Machine Learning - Machine Learning Development Life Cycle - Principal Component Analysis Tutorial
- PCA - Principal Component Analysis
Introduction-
It is used in Unsupervised learning & complex technique
Main aim to reduce curse of dimensionality, to avoid the number of computation on high dimensional data.
PCA is a technique to Transform higher dimensional data to lower dimensional data while keeping the essence of data, i.e visualization
It remove noise, and extract crucial information such as features and attributes from large amounts of data
Benefit of PCA:-
Faster Exceution Of Algoritm
Visualization (e.g reducing 10 D to 2 D)
Geometric intuition
- In Dataset, suppose there is (No. Of Rooms, No. Of Grocery Shop, target column- Price), from this only No. of Room is more important than no. of grocery. Hence, using feature selection ,we will select No. of rooms column only.
- If you don’t have an idea of domain of any project, plot the graph both column, and check variance, select column with higher projection.

- Feature selection will not work, when both the column are equally important(e.g No. of rooms & No. of bathroom), same variance. In such case, we need to use feature extraction.
- In feature extraction, when both the column are equally important(e.g No. of rooms & No. of bathroom),same variance. Then it will combine both column and convert it into single column i.e total flat size.
But in below case when have a idea about the data, suppose we don’t have an idea about the domain we are are working, then in this case we will use PCA.

In PCA, it will rotate the graph , and create new axis PC1, PC2 which is a principal component. After that, we are able to find variance of PC! > PC2. Hence, we will select PC1(i.e room column).
PCA use variance to calculate spread by using projection on unit vector. But variance has problem that it will give same result for (-1,1)(0,0)(1,-1) and (-1.-1)(0,0)(1,1). i.e it doesn’t show direction between this 2 variable.

Hence, covariance came into picture which tells us the direction of the linear relationship between two random variables. Covariance matrix tell us both spread (variance) and direction(covariance) in a single matrix.
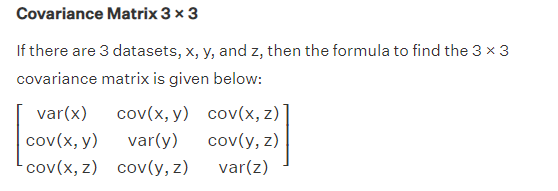
Learn about covariance & covariance matrix more in statistics
- Linear Transformation – Eigen Vector and Eigen Values
Eigen Vector
Eigenvector of a square matrix is defined as a non-vector in which when a given matrix ‘A’ is multiplied with a non-zero vector ‘v’, then it is equal to a scalar quantity λ (known as eigen value), and the given vector x (known as eigen vector), such that:
Av = λx
The number or scalar value “λ” is an eigenvalue of A. and x is eigenvector of A.
Eigen Vector are special vector in which on applying linear transformation, the direction will not change, only magnitude change, for example –
3 1
0 2
Eigen Value(λ)
Eigenvalues are the special set of scalars associated with the system of linear equations. It is the value with which magnitude change from original to transformation.it is also known as explained variance.
In the above problem, then eigen value is 2 , as the magnitude change from (-1,1) to (-2,2)

What Exactly PCA will do?
In PCA , eigen decomposition(i.e finding eigen vector and eigen value) will be done of covariance matrix, and whose eigen decomposition is greater will have more spread or variance. We will consider Principal component or feature with greater eigen decomposition.
Step by step solution of PCA-
1] Mean Centering
2] Find Covariance matrix
3] Find Eigen Value and Eigen Vector for covariance matrix
You will get 3 eigen vector and 3 eigen value for 3D covariance matrix.
Whose eigen value is greater will be considered as PC1, next one will be PC2, next will be PC3.
To transform 3D to 2D, you will consider only PC1 and PC2.
How to transform points from 3D to 2D ?
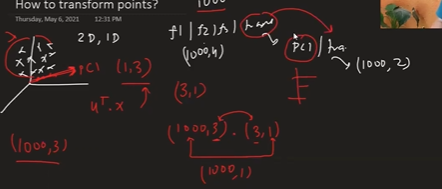
Suppose dataset is (1000,3) and we need to convert it into (1000,2)
Our eigen vector is (3,3), but we only consider PC1 and PC2. i.e (3,2)
On dot product (1000,3) and (3,2). We will get our 2D dataset i.e (1000,2)
Finding Optimum number of principle components?
Linear Distribution Analysis
TSNE
- Sparsity & Density
When representing data using a matrix, we can quantify the number of empty values it contains. This is referred to as its sparsity. A matrix (or dataset) that mostly contains zeros is called a sparse matrix.
Non-empty value is referred to as density.