Statistics for AIML - Regression Metrics - Kurtosis Tutorial
Kurtosis is a statistical measure that defines how heavily the tails of a distribution differ from the tails of a normal distribution. In other words, Kurtosis is all about the tails of the distribution – not the peakness or flatness. It measures the tail heaviness of the distribution. Kurtosis is calculated as:
In Python :
import numpy as np
from scipy.stats import kurtosis
x = np.random.normal(0, 2, 10000) # create random values based on a normal distribution
print(kurtosis(x))
Just for Reference:
Mathematically:
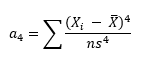
where n is the sample size, Xi is the ith X value, X-Bar is the average and s is the sample standard deviation. Note the exponent in the summation. It is “4”. The kurtosis is referred to as the “fourth standardized central moment for the probability model.”
Note: Kurtosis calculated by Excel or through Python/R is actually excess kurtosis, which is (Kurtosis – 3)
High kurtosis in a data set is an indicator that data has heavy tails or outliers. If there is a high kurtosis, then, we need to investigate - why we have so many outliers. It indicates a lot of things, maybe wrong data entry or other things. Investigate!
Low kurtosis in a data set is an indicator that data has light tails or a lack of outliers. If we get low kurtosis(too good to be true), then also we need to investigate and trim the dataset of unwanted results.
What is Excess Kurtosis?
Excess kurtosis is a metric that compares the kurtosis of a distribution against the kurtosis of a normal distribution. The kurtosis of a normal distribution equals 3. Therefore, the excess kurtosis is found using the formula below:
Excess Kurtosis = Kurtosis – 3

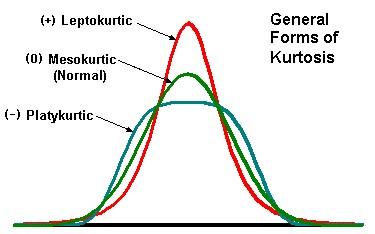
Leptokurtic (Kurtosis > 3): Distribution is longer, and tails are fatter. Peak is higher and sharper than Mesokurtic, which means that data are heavy-tailed or profusion of outliers. Outliers stretch the horizontal axis of the histogram graph, which makes the bulk of the data appear in a narrow (“skinny”) vertical range, thereby giving the “skinniness” of a leptokurtic distribution.
Mesokurtic: This distribution has kurtosis statistics similar to that of the normal distribution. It means that the extreme values of the distribution are similar to that of a normal distribution characteristic. This definition is used so that the standard normal distribution has a kurtosis of three.
Platykurtic: (Kurtosis < 3): Distribution is shorter; tails are thinner than the normal distribution. The peak is lower and broader than Mesokurtic, which means that data are light-tailed or lack outliers. The reason for this is because the extreme values are less than that of the normal distribution.
Uses of Kurtosis:
1. Depicts the shape of the distribution - especially tails.
2. Outlier Detection: Large Kurtosis suggests there could be outliers in the data.
3. With high kurtosis, there is a chance of high variance, and hence testing on Mean could lead to bad results.
Hence, in that case, we would need to choose a more robust option – like a test on the Median.
4. Financial Risk: E.g. The return of your asset can be farther from the mean. (Than predicted using normal
distribution).