Statistics for AIML - Descriptive statistics - Covariance vs. Correlation Tutorial
Covariance and correlation both are the same only, the difference is correlation ranges between -1 to 1, while covariance has no such restriction (-∞ and +∞).
-
Correlation Coefficient greater than zero indicates a positive relationship
-
while a value less than zero signifies a negative relationship
-
and a value of zero indicates no relationship between the two variables being compared.
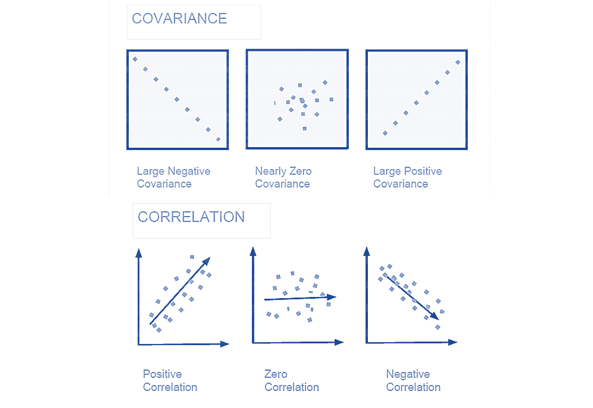
Covariance measures the direction of a relationship between two variables,
Correlation measures both the strength and direction of the linear relationship between two variables.
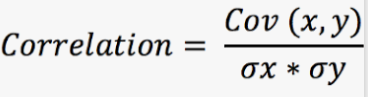
- cov(X,Y) = covariance of X and Y
- σX = population standard deviation of X
- σY = population standard deviation of Y
We measure the correlation with the help of the Correlation Coefficient.
For example, height and weight are related; taller people tend to be heavier than shorter people.
What is the Correlation Coefficient?
Pearson’s correlation coefficient (r) is a measure that determines the degree to which the movement of two variables is associated. The value of the Correlation Coefficient lies between -1 and 1.
Strong and Weak Correlation:
Kind of correlation = depicted by the sign of correlation coefficient
How Strong =. Value of Correlation Coefficient

Correlation(r) - Direction and Strength
- r has a value between 1 and -1
The strength of the linear relationship increased as r got close to 1 or -1
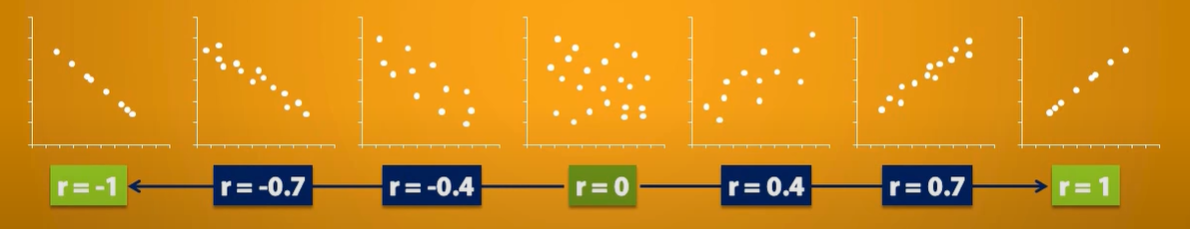
Rule of thumb: Any relationship with a magnitude of r greater than 0.75 can be considered to be a strong correlation.
For e.g.: -0.84 is a strong Negative correlation and 0.90 is a strong positive correlation.
In Python: DataFrame.corr(method=’pearson’)
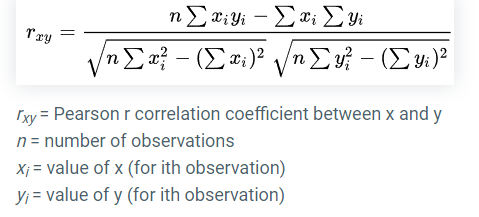
Pearson Correlation Coefficient(Standard Formula)-
OR
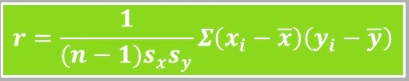
(n = sample size, and Sx, Sy is the standard deviation of samples x and y. X-bar and y-bar are the respective means of x and y samples whereas Xi and Yi are sample points of X and Y respectively.)
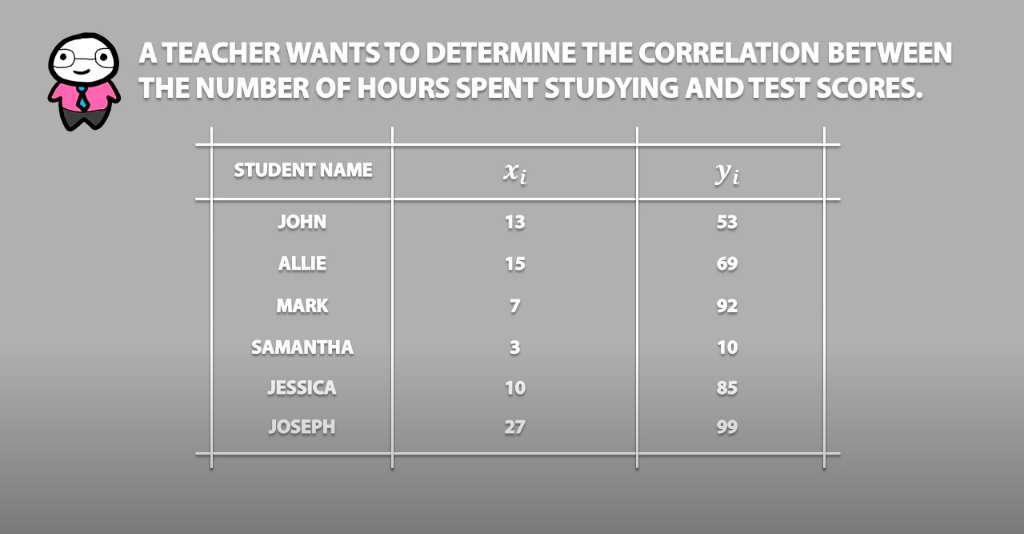
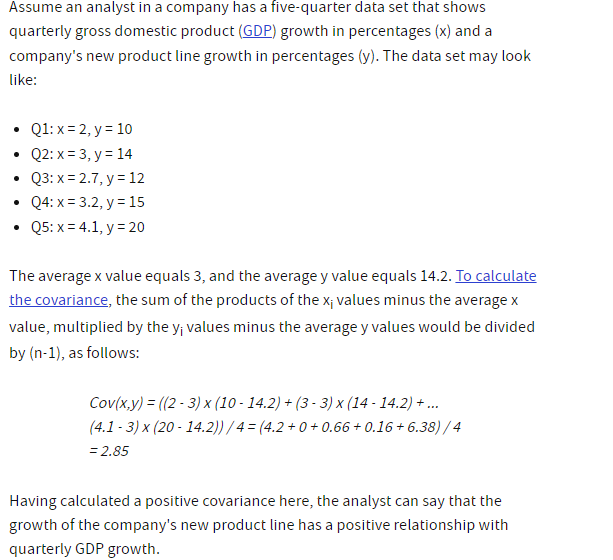
Example 1 -
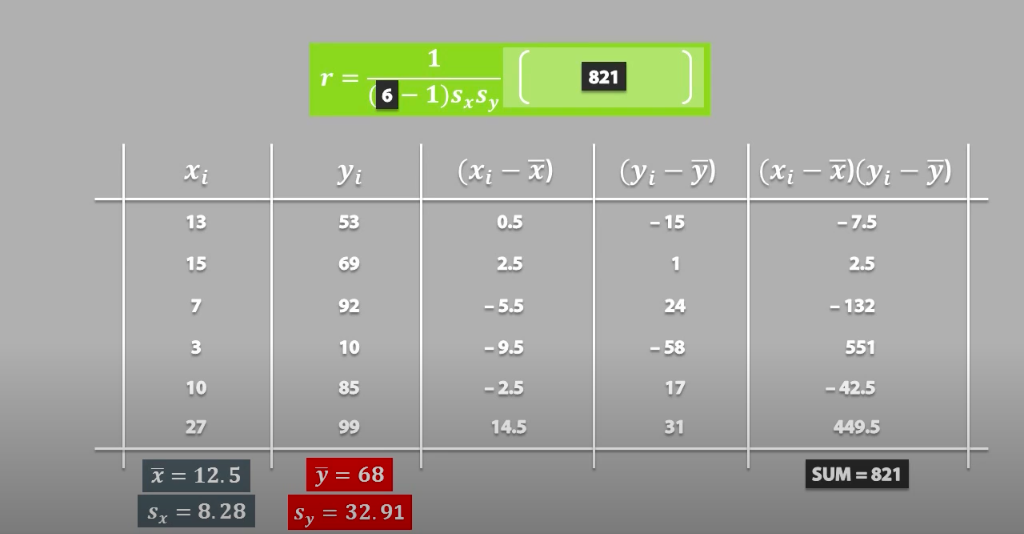
Therefore r = 0.6 i.e. medium positive correlation
https://www.scribbr.com/statistics/correlation-coefficient/
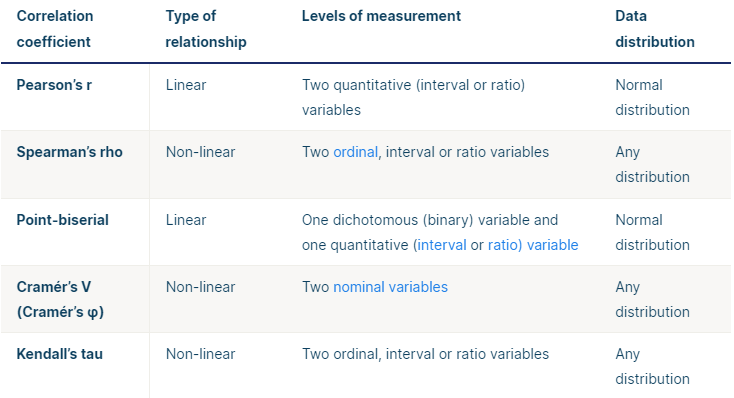
Spearman Rank Correlation
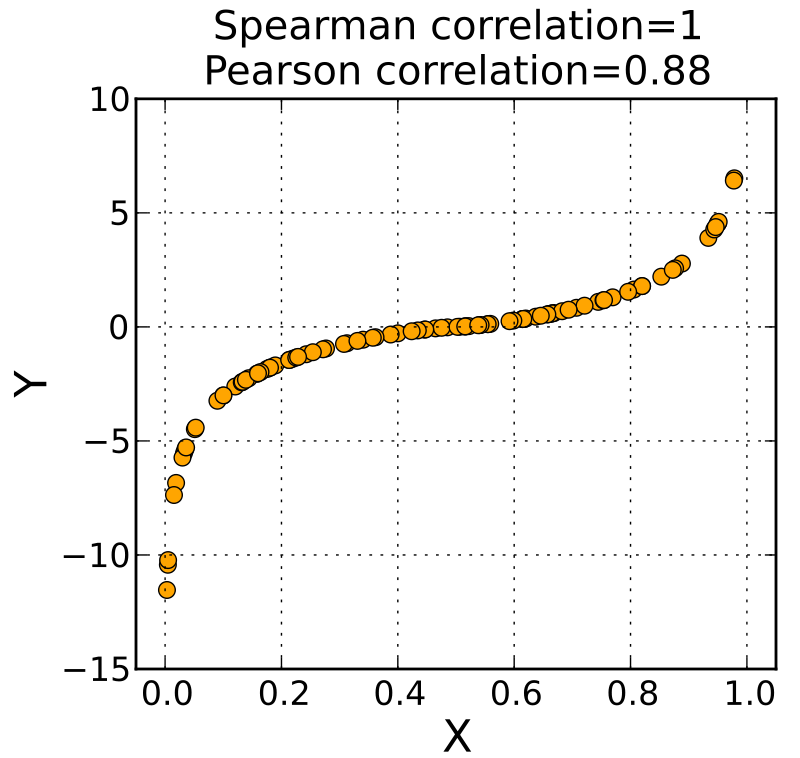
- Used for Non-Linear Variables
- Spearman Corr Coeff = Pearson Corr coeff (rank varaibles)
- In Python: DataFrame.corr(method=’spearman’)

- Denoted by Rho.
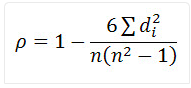
Steps for Spearman Correlation Coefficient
- Create a new column for rank(x) and assign the rank of each variable.
- Assign the rank of the 2nd variable in a new column rank(y).
- Calculate the difference in rank of both the variables = d.
- Calculate the d-squared.
- Add up the d-squared score.
- Put in the formula provided:
Example 2: The scores for 10 students in English and Maths are as follows:
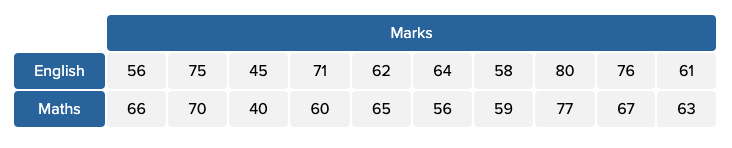
Compute the Spearman rank correlation.
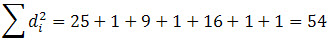
Solution - (step 1,2,3 and 4)

step 5:
Step 6:
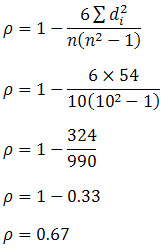
Hence, the Spearman Rank Coefficient is 0.67.
Example 3 -
Covariance Matrix
A Covariance Matrix is a square matrix that measures how much two random variables get changed together. It is actually used for computing the covariance in between every column of data matrix. The Covariance Matrix is also known as dispersion matrix and variance-covariance matrix.
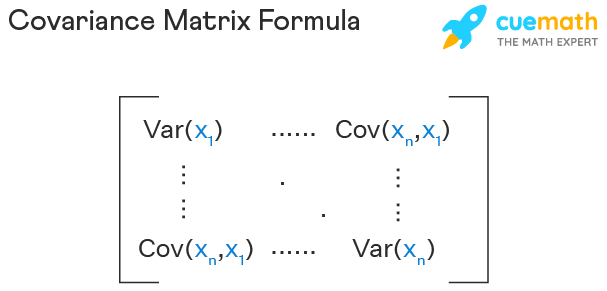

For Example – https://www.cuemath.com/algebra/covariance-matrix/