Statistics for AIML - Regression Metrics - Accuracy Tutorial
Accuracy is the number of correctly predicted data points out of all the data points. More formally, it is defined as the number of true positives and true negatives divided by the number of true positives, true negatives, false positives, and false negatives.
Accuracy Score = No. Of Correctly Prediction / Total No. Of Data Point
OR
Accuracy Score = (TP+TN)/(TP+TN+FP+FN)
How much accuracy is good?
It depend on the problem that we are solving.
Problem with accuracy.
- Accuracy cannot help in rectifying incorrect prediction type
- Actually student is placed, but model showing not placed
- Actually student is not placed, but model showing it is placed.
- Accuracy cannot rectify incorrect prediction type from the above two.
- To solve this problem atrix came into picture.
- Accuracy should be high as possible.
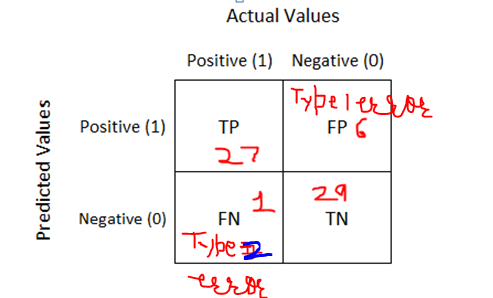
Confusion matrix-
It is a performance measurement for machine learning classification problem where output can be two or more classes. It is a table with 4 different combinations of predicted and actual values.
It is extremely useful for measuring Recall, Precision, Specificity, Accuracy, and most importantly AUC-ROC curves.
Let’s understand TP, FP, FN, TN in terms of placement analogy.
True Positive:
- Interpretation: You predicted positive and it’s true.
- You predicted that a (27) student is placed and actually it is placed.
True Negative:
- Interpretation: You predicted negative and it’s true.
- You predicted that a (29) student is not placed and actually it is not placed.
False Positive: (Type 1 Error)(FP1)
- Interpretation: You predicted positive and it’s false.
- You predicted that a (6) student is placed but actually it is not placed.
False Negative: (Type 2 Error)(FN2)
- Interpretation: You predicted negative and it’s false.
- You predicted that a (1) student is not placed but actually it is placed.
We cannot find confusion matrix from accuracy score. But we can find accuracy score from confusion matrix .
Accuracy Score = (TP+TN)/(TP+TN+FP+FN)
Type 1 Error = No. Of False Positive
Type 2 Error = No. Of False Negative
Precision, Recall and F1 score
Precision – True Positive/ Predicted Positive
To get the value of precision we divide the total number of correctly classified positive examples by the total number of predicted positive examples.
Precision = TP/(TP+FP)
Precision should be high as possible.
Recall –
Sensitivity or True Positive Rate i.e True Positive/ Actual Positive
Proportion of actual positive is correctly predicted.
Recall can be defined as the ratio of the total number of correctly classified positive examples divide to the total number of positive examples.
Recall = TP/(TP+FN)
Recall should be high as possible.
F1 Score-

It is difficult to compare two models with low precision and high recall or vice versa. So to make them comparable, we use F1-Score. F-1score helps to measure Precision and Recall at the same time. It uses Harmonic Mean in place of Arithmetic Mean by punishing the extreme values more.
Specificity -
True Negative Rate i.e True negative / Actual Negative
Specificity = TN/(TN+FP)
It is similar to recall but the shift is on the negative instances. Like finding out how many healthy patients were not having cancer and were told they don’t have cancer. Kind of a measure to see how separate the classes are.
False Positive Rate = (1 – sensitivity)
= False Positive / Actual Negative = FP/(TN+FP)