Statistics for AIML - Introduction
What is Statistics?
Statistics is a mathematical science including methods of collecting, organizing, and analyzing data in such a way that meaningful conclusions can be drawn from them. In general, its investigations and analyses fall into two broad categories called descriptive and inferential statistics.
Descriptive Statistic Vs Inferential Statistics
Descriptive Statistic
It deals with the processing of data without attempting to draw any inferences from it. The characteristics of the data are described in simple terms. Events that are dealt with include everyday happenings such as accidents, prices of goods, business, incomes, epidemics, sports data, and population data.
Inferential statistics
It is a scientific discipline that uses mathematical tools to make forecasts and projections by analyzing the given data. This is of use to people employed in such fields as engineering, economics, biology, the social sciences, business, agriculture, and communications
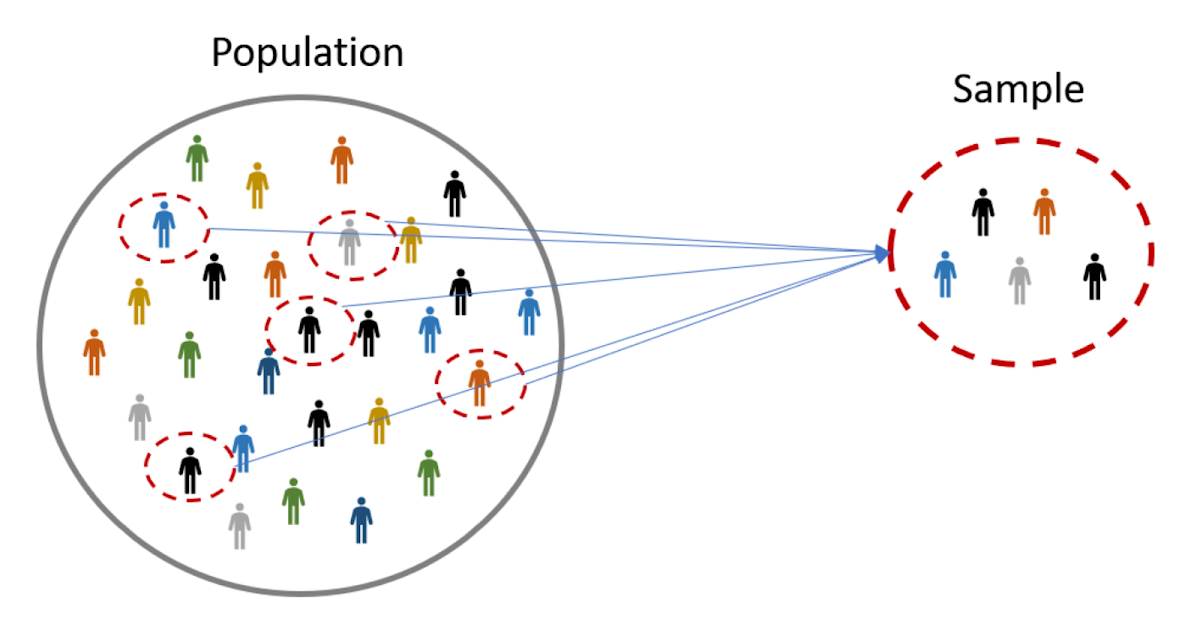
Population (N) - Population contains all the data points from a set of data.
Sample (n) - The sample consists of some observations selected from the population. Its characteristics
should be the same as the population.
Sample Size - Total amount of things in a sample
No. Of Sample - Total no. of sample
Variable - Whatever we are studying.(Measurable, Countable, Categorized)

The parameter is a metric related to the population
Statistics (Mean) is a metric related to the sample
Type Of Data-
Numerical Or Quantitative Data
- Data that is measured in numbers. It deals with numbers that make sense to perform arithmetic calculations with Quantitative variables (e.g. height, weight, etc.)
Discrete- Refer to the variable that can only be measured in certain numbers (e.g. 0, 1, 2, 3, etc.)
Continuous- Refer to the variable that can take on any numerical value (e.g. 105, 1.23, 7.5, etc.)
Categorical Data
- Refers to the values that place "things" into different groups or categories (e.g. hair color, type of cat, letter grade)
Ordinal- Refer to the variable that can only be in a logical order to the values of a categorical variable (e.g. Letter Grade - A. A+, B, B+, C...)
Nominal- Refer to the variable that has no logical ordering of a categorical variable (e.g. Hair Color - Red, Blonde, Brown, Blue...)
Univariate- Analysis on 1-column,
Bivariate – Analysis on 2-column
Multivariate – Analysis on multiple columns(Learn EDA for more)
Developing Statistical Thinking
Statistics include numerical facts and figures. For instance:
• The largest earthquake measured 9.2 on the Richter scale.
• Men are at least 10 times more likely than women to commit murder.
• One in every 8 Americans is COVID-positive.
The study of statistics involves math and relies upon calculations of numbers. But it also relies heavily on how the numbers are chosen and how the statistics are interpreted. For example, consider some scenarios and the interpretations based on the presented statistics.
1. A new advertisement for Amul’s ice cream introduced in late May of last year resulted in a 30% increase in ice cream sales for the following three months. Thus, the advertisement was effective.
2. The more liquor shops in a city, the more crime there is. Thus, liquor shops lead to crime.
Correct Answer-
- Flaw: A major flaw is that ice cream consumption generally increases in the months of June, July, and August regardless of advertisements. This effect is called a history effect and leads people to interpret outcomes as the result of one variable when another variable (in this case, one has to do with the passage of time) is actually responsible.
- Flaw: A major flaw is that both increased liquor shops and increased crime rates can be explained by larger populations. In bigger cities, there are both more liquor shops and more crime. This problem refers to the third-variable problem. Namely, a third variable can cause both situations; however, people erroneously believe that there is a causal relationship between the two primary variables rather than recognizing that a third variable can cause both.
Hence, the correct Interpretation of the numbers is necessary. It means there should be a fair comparison between the data.
E.g Covid cases will be higher in large-population countries rather than the low population countries which shows that large population is more affected by covid
A large population of 50 lac people has 5 Lac covid cases i.e. 5 out of 50 is covid positive
A small population of 5 lac people has 70 thousand covid cases i.e. 7 out of 50 is covid positive
5/50 < 7/50
which means a small population country is more affected than a large population