Statistics for AIML - Descriptive statistics - Covariance and Covariance matrix Tutorial
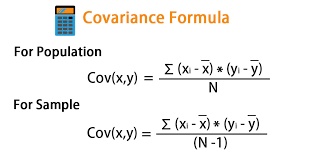
Covariance tells us the direction of the linear relationship between two random variables. It can take any value between - ∞ and + ∞.
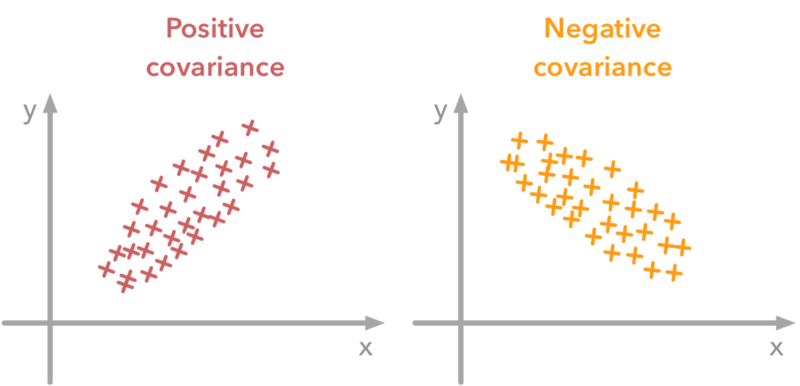
Positive Covariance
When two stocks tend to move together in the same direction, they are seen as having a positive covariance
Negative Covariance
When two stocks tend to move in opposite directions, they are seen as having a negative covariance
Difference between variance and co-variance?
In Python: use the cov() function
Correlation
Correlation tells us how strongly two random variables are related to each other. It takes values between -1 to +1. The correlation coefficient is also known as Pearson’s correlation coefficient.
Negative means they are inversely proportional to each other with the factor of correlation coefficient value.
Positive means they are directly proportional to each other and the mean varies in the same direction with the factor of correlation coefficient value.
if the correlation coefficient is 0 then it means there is no linear relationship between variables.

MutliCollinearity
Multicollinearity occurs when two or more independent variables are highly correlated with one another in a regression model.
In other words, one predictor variable can be used to predict the value of another. This created redundant information, skewing the results in a regression model.
For example:-
Suppose, In a table of cgpa, iq, and lpa where cgpa and iq is independent variable. If changing the value of cgpa will also make similar changes in IQ, then this independent variable is highly correlated. Hence, it is known as multicollinearity.
In this case, you can remove any one independent feature to predict the package of students.
Is multicollinearity always bad?
If you are using it for prediction in simple linear regression. Then it is not bad. But if you are especially calculating it for feature importance(B0, B1, and B2). Then is bad
Types Of Multicollinearity-
Structural - This multicollinearity happens when we create features with our own, such as One Hot Encoding, i.e. if we do not remove the first feature using drop_first=True.
Databased – In this, column is already correlated.
Multicollinearity can be detected via various methods.
- Domain Knowledge (e.g. cgpa and iq)
- Scatter Plot (between 2 columns and see pattern)
- Correlation Matrix (using corr() and put it in heatmap)
- VIF (Variance Inflation Factors).
” VIF determines the strength of the correlation between the independent variables. It is predicted by taking a variable and regressing it against every other variable. “
R^2 value is determined to find out how well an independent variable is described by the other independent variables. A high value of R^2 means that the variable is highly correlated with the other variables. This is captured by the VIF which is denoted below:
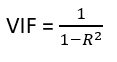
So, the closer the R^2 value to 1, the higher the value of VIF and the higher the multicollinearity with the particular independent variable.
VIF starts at 1 and has no upper limit
VIF = 1, no correlation between the independent variable and the other variables
VIF exceeding 5 or 10 indicates high multicollinearity between this independent variable and the others
How to remove MultiCollinearity?
Increase more data
Remove 1 of the correlated independent column
Using Lasso and Ridge Regression
Using PCR – Principal Component Regression