Statistics for AIML - Descriptive statistics - Calculate Z Score Tutorial
Z-scores can quantify the unusualness of an observation when your data follow the normal distribution. Z-scores are the number of standard deviations above and below the mean that each value falls, assuming a Normal distribution.
For example, a Z-score of 2 indicates that an observation is two standard deviations above the average while a Z-score of -2 signifies it is two standard deviations below the mean.

Point to understand:
The further away an observation’s Z-score is from zero, the more unusual it is. A standard cut-off value for finding outliers is Z-scores of +/-3 or further from zero. In a population that follows the normal distribution, Z-score values more extreme than +/- 3 have a probability of 0.0027 (2 * 0.00135), which is about 1 in 370 observations.
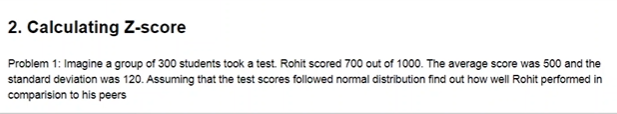
Step 1 – Calculate Z Score
Therefore Z Score is (700-500)/120 = 1.6666, where 700 is x, 500 is the mean, and 120 is the standard deviation.
Step 2 – Lookup the Z-table - http://www.z-table.com/
Decompose 1.6666 into 1.6 and 0.06. Now look in Z table-

Hence, the value is 0.9515
Step 3 – Multiply by 100
.9515 * 100 = 95.15 %
This means Rohit performed better than 95% of his peers.
Example: Consider the below dataset. Find out the outlier using the Z-score method.
1, 2, 2, 2, 3, 1, 1, 15, 2, 2, 2, 3, 1, 1, 2
Solution -
Mean = 2.66
Std = 3.36
Ref:
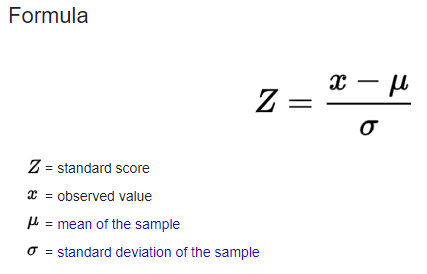
Z score formula =

Z (1) = (1 – 2.66)/3.36 = -0.49405
Z(2) = (2 – 2.66)/3.36 = -0.19643
Z(3) = (3 – 2.66)/3.36 = 0.10119
Z(15) = (15 – 2.66)/3.36 = 3.67262
We will term the point outlier if it has a z-score of 3 or above (on any side - positive or negative).
Hence, here the outlier is 15