Python - Python Advanced - Pandas Tutorial
Pandas is a open source Python library used for working with data sets.
It has functions for analyzing, cleaning, exploring, and manipulating data.
Why pandas?
Array contains homogenous data.
Allow to analyze big data and make conclusion based on statistical theories. Mostly used in data science.
Visualization is good in pandas, clean data.
Data Structure in pandas
1] Series - 1D - A Pandas Series is like a column in a table.
2] Dataframe - 2D - A Pandas DataFrame is a 2 dimensional data structure, or a table with rows and columns.
Installation-
pip install pandas
Importing Pandas-
import pandas as pd
as - is used for alias to create a short name of pandas i.e pd
1] Series
How to create a series?
i] List
ii] Array
iii] Dictionary
i] List
# list

names = ['sam' , 'raman' , 'bittu', 'Dhanraj']
pd.Series(names)
Output-
0        sam
1      raman
2      bittu
3    Dhanraj
dtype: object
df = pd.Series(names)
print(df.shape)
print(df.ndim)
Output-
(4,)
1
To change the index from digit to alphabet-
pd.Series(names, index = ['a','b','c','d'])
Output-
a        sam
b      raman
c      bittu
d    Dhanraj
dtype: object
# index len should be always equal to len of data
2] Array
pd.Series(np.arange(10,15))
Output-
0    10
1    11
2    12
3    13
4    14
dtype: int64
pd.Series(np.arange(10,15) , index = [100,200,300,400,500])
Output-
100    10
200    11
300    12
400    13
500    14
dtype: int64
3] Dictionary
student = {'name1':'sam' , 'name2':'saurabh' , 'name3': 'Dhanraj' , 'name4':'Ramesh'}
pd.Series(student)
Output-
name1        sam
name2    saurabh
name3    Dhanraj
name4     Ramesh
dtype: object
In dictionary key become the index.We cannot change the value of key/index in dictionary. If we try to change also, the value will become NaN.
pd.Series(student, index = [0,1,2,'name1'])
Output-
0        NaN
1        NaN
2        NaN
name1    sam
dtype: object
Indexing
student = {'name1':'sam' , 'name2':'saurabh' , 'name3': 'Dhanraj' , 'name4':'Ramesh'}
df = pd.Series(student)
df
Output-
name1        sam
name2    saurabh
name3    Dhanraj
name4     Ramesh
dtype: object
- using the custom indexing
df['name2']
Output-
'saurabh'
- using the zero indexing
df[1]
Output-
'saurabh'
Slicing
- using custom indexing start - inclusive , stop- inclusive
- using the zero indexing - start - inclusive , stop- exclusive
- Custom Indexing
student = {'name1':'sam' , 'name2':'saurabh' , 'name3': 'Dhanraj' , 'name4':'Ramesh'}
df = pd.Series(student)
df['name1':'name3':2]
Output-
name1        sam
name3    Dhanraj
dtype: object
- Zero Indexing
student = {'name1':'sam' , 'name2':'saurabh' , 'name3': 'Dhanraj' , 'name4':'Ramesh'}
df = pd.Series(student)
df[0:3:2]
Output-
name1        sam
name3    Dhanraj
dtype: object
Create a dataframe in such as way where currency is index and country is value.
brics_country = ['Brazil', 'Russia', 'India', 'China', 'South Africa']
brics_currency = ['Real', 'Ruble', 'Rupee', 'Renminbi', 'Rand' ]

df=pd.Series(brics_currency,brics_country)
df
Output-
Brazil              Real
Russia             Ruble
India              Rupee
China           Renminbi
South Africa        Rand
dtype: object
df.index
Output-
Index(['Brazil', 'Russia', 'India', 'China', 'South Africa'], dtype='object')
df.values
Output-
array(['Real', 'Ruble', 'Rupee', 'Renminbi', 'Rand'], dtype=object)
2] Dataframe
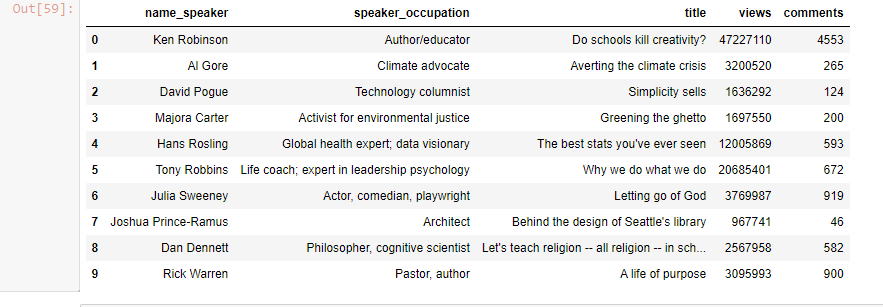
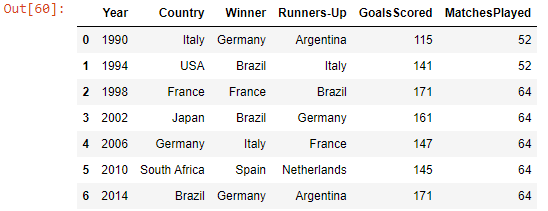
i] Using the file-
#csv
df = pd.read_csv('datasets/ted_data.csv')
df
Output-
#xlsx
df = pd.read_excel('datasets/football_worldcup.xlsx')
df
Output-
ii] Create a dataframe using dictionary-
df_dict = {'Year' : [1990, 1994, 1998, 2002],
           'Country' : ['Italy', 'USA', 'France', 'Japan'],
           'Winner' : ['Germany', 'Brazil', 'France', 'Brazil'],
           'GoalScored' : [115, 141, 171, 161]
          }

pd.DataFrame(df_dict)
Output-
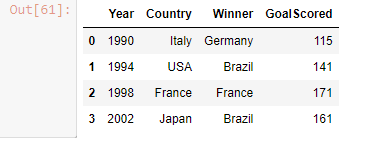
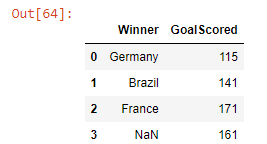
In dictionary, all array must be of same length. This issue can be solved in series, it takes NaN inplace of empty value.
iii] Create dataframe using series
df_dict_udindex = {'Winner' : pd.Series(['Germany', 'Brazil', 'France'],
                                         ),
                   'GoalScored' : pd.Series([115, 141, 171, 161],
                                            ),
                  }

pd.DataFrame(df_dict_udindex)
Output-
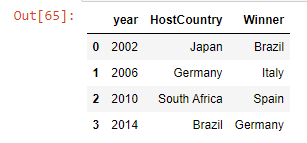
iv] Create a df using list of dic
df_lodict = [
             {'year' : 2002, 'HostCountry' : 'Japan', 'Winner' : 'Brazil'},
             {'year' : 2006, 'HostCountry' : 'Germany', 'Winner' : 'Italy'},
             {'year' : 2010, 'HostCountry' : 'South Africa', 'Winner' : 'Spain'},
             {'year' : 2014, 'HostCountry' : 'Brazil', 'Winner' : 'Germany'},
            ]

pd.DataFrame(df_lodict)
Output-
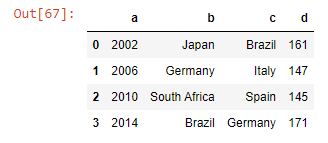
v] List of tuples
df_lotuples = [(2002, 'Japan', 'Brazil', 161),
                (2006, 'Germany', 'Italy', 147),
                (2010, 'South Africa', 'Spain', 145),
                (2014, 'Brazil', 'Germany', 171)
              ]

# To put column name manully, we can give it like this-
pd.DataFrame(df_lotuples , columns = ['a' , 'b' , 'c' , 'd'])
Output-
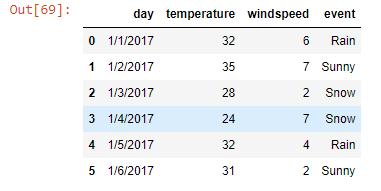
Basic Of Pandas
weather_data = pd.read_csv('datasets/weather_data.csv')
weather_data
Output-
i] shape
weather_data.shape
Output-
(6, 4)
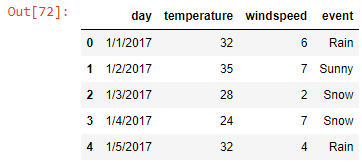
ii] head() - top n data - head() -- deafult value is 5
weather_data.head(2)
Output-

weather_data.head()
Output-
iii] tail() - bottom n data - tail() -- deafult value is 5
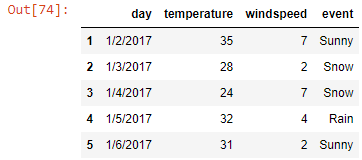
weather_data.tail(2)
Output-

weather_data.tail()
Output-
iv] info()
weather_data.info()
Output-
<class 'pandas.core.frame.DataFrame'>
RangeIndex: 6 entries, 0 to 5
Data columns (total 4 columns):
 #   Column       Non-Null Count  Dtype
---  ------       --------------  -----
 0   day          6 non-null      object
 1   temperature  6 non-null      int64
 2   windspeed    6 non-null      int64
 3   event        6 non-null      object
dtypes: int64(2), object(2)
memory usage: 320.0+ bytes
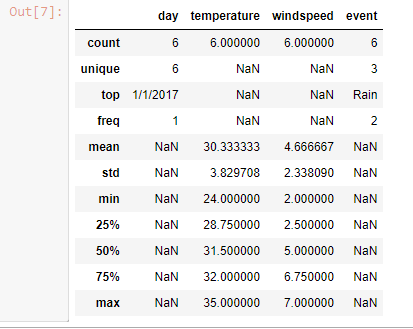
v] describe()
describe() method is used for calculating some statistical data like percentile, mean and std of the numerical values of the Series or DataFrame
df = pd.read_csv('datasets/weather_data.csv')
df.describe()
Output-
       temperature  windspeed
count  6.000000     6.000000
mean   30.333333    4.666667
std    3.829708     2.338090
min    24.000000    2.000000
25%    28.750000    2.500000
50%    31.500000    5.000000
75%    32.000000    6.750000
max    35.000000    7.000000
df.describe(include = 'object')
Output-
         day	event
count	  6	      6
unique	  6	      3
top	    1/1/2017 Rain
freq	  1	      2
df.describe(include = 'all')
Output-
Slicing and indexing
df = pd.read_csv('datasets/citibike_tripdata.csv')
df
Output-

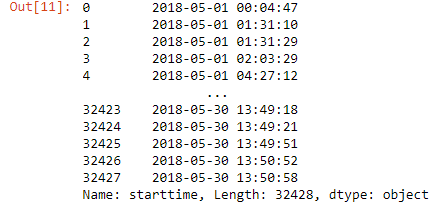
# Select a particular column - It will give a series datatype
df['starttime']
Output-
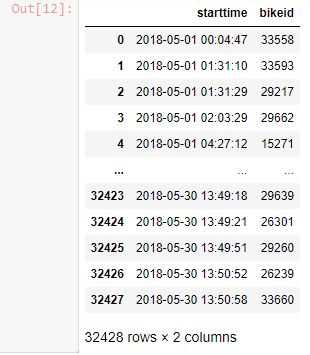
# Select 2 or more data type
df[['starttime', 'bikeid']]
Output-
Operations-
1. normal slicing
2. loc
3. iloc
1] Normal Slicing
Syntax -
df[start:stop:step] / df[start_row_name : stop_row_name : step]
- custom indexing
- zero indexing
-it can do slicing only on rows
df[::2]
Output-

df[2:11]
Output-
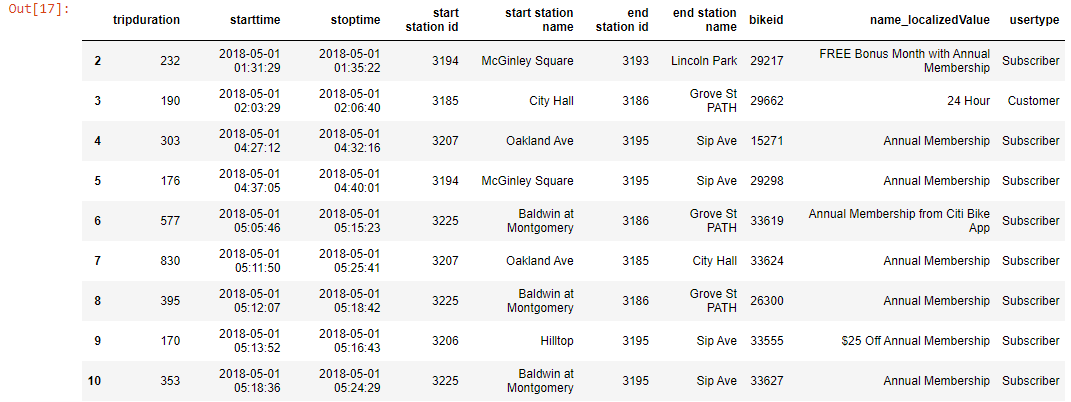
df_new = df[0:6]
df_new
Output-

index = ['row1' , 'row2' , 'row3' , 'row4' , 'row5' , 'row6']
df_new.index = index
df_new
Output-

i] zero indexing
df_new[2::2]
Output-

ii] Custom indexing
df_new['row2'::2]
Output-

2] loc
- it can be done both on rows as well as column
- syntax df.loc['start' : 'stop' : step , start:stop:step]
- you can only do custom indexing
df_new
Output-

df_new.loc[0::2]
Output-
TypeError: cannot do slice indexing on Index with these indexers [0] of type int
df_new_2 = df[0:6:]
df_new_2
Output-

df_new
Output-

df_new.loc['row1': 'row3' , ::2]
Output-

df_new.loc[::2,'starttime':'bikeid']
Output-

df_new.loc[['row1' , 'row3' , 'row4'], ['tripduration' , 'bikeid' , 'usertype']]
Output-

df
Output-
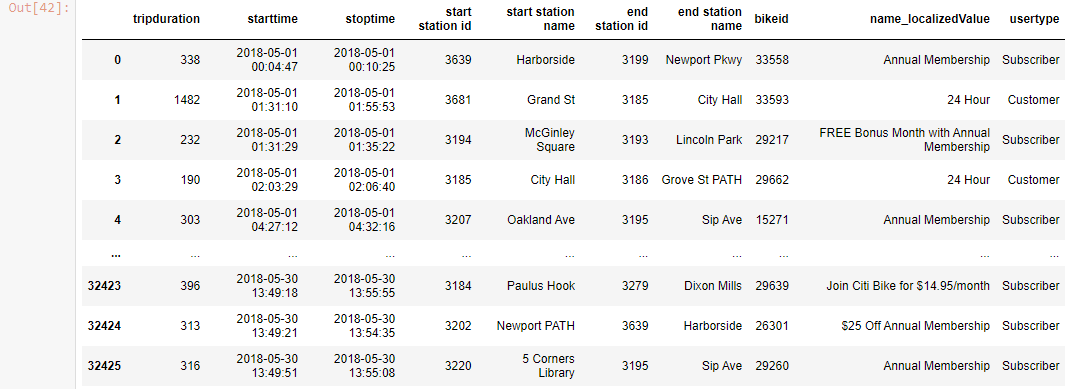
df.loc[df['tripduration']>400]
Output-

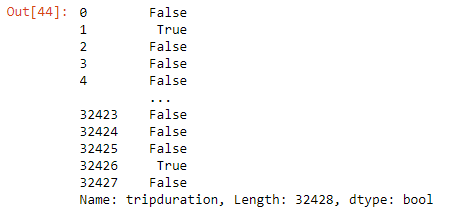
df['tripduration']>400
Output-
# give me all the data whose user type is 'subscriber'
df.loc[df['usertype']=='Subscriber']
Output-

3. iloc
- it can do slicing both on index as well column
- zero indexing
- syntax df.iloc['start' : 'stop' : step , start:stop:step]
df_new.iloc['row1':'row2']
Output-
TypeError: cannot do positional indexing on Index with these indexers [row1] of type str
df_new.iloc[1:3]
Output-

df_new
Output-

df_new.iloc[1:3 , 2:5]
Output-

normal - rows
- zero / custom
loc - both
- custom
- filter
iloc - both
- zero
Addition and Deletion in the data frame
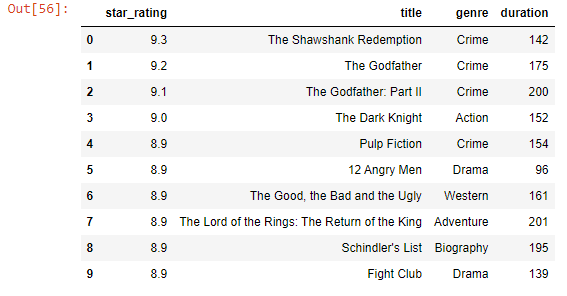
df = pd.read_csv('datasets/imdb_rating.csv')
df
Output-
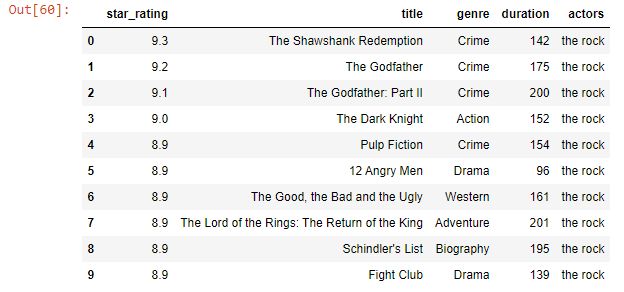
Adding a column-
df['actors'] = 'the rock'
df
Output-
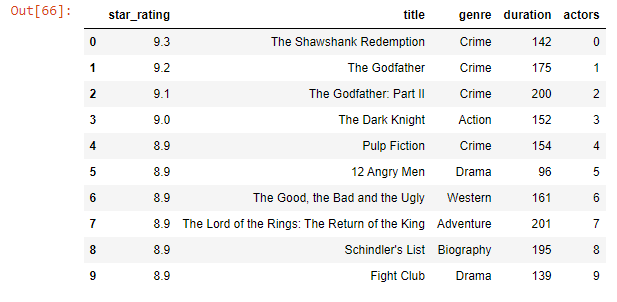
df['actors'] = range(0,10)
df
Output-
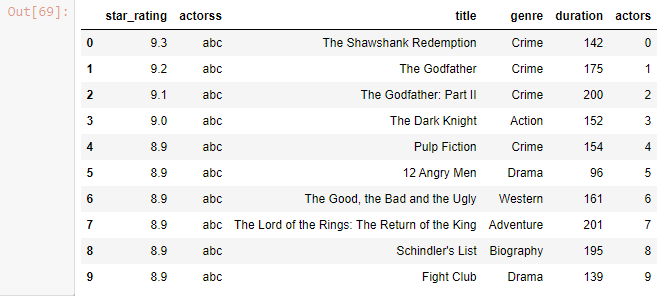
Insert Column
df.insert(1,'actorss','abc')
df
Output-
df = pd.read_csv('datasets/imdb_rating.csv')
df
Output-
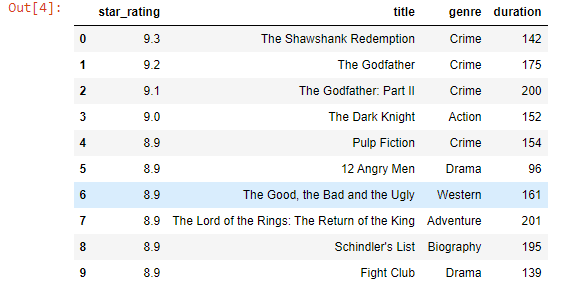
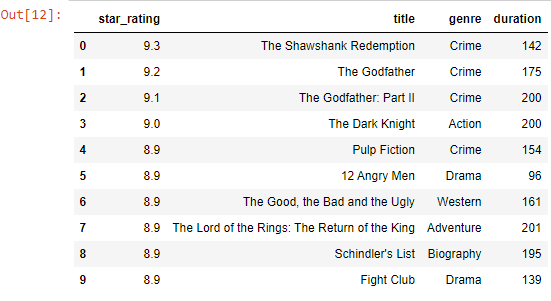
df.loc[df['duration']==152].index[0]
Output-
3
df.loc[df.loc[df['duration']==152].index[0] , 'duration'] = 200
df
Output-
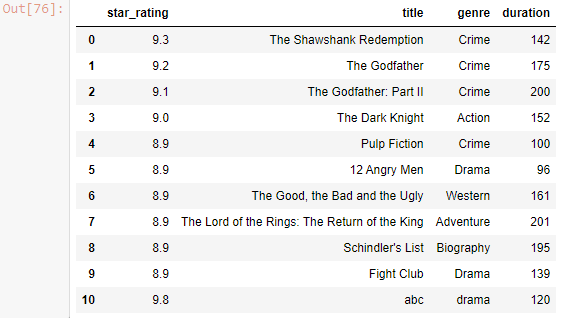
Adding a row
df.loc[len(df)] = [9.8 , 'abc' , 'drama' , 120]
df
Output-
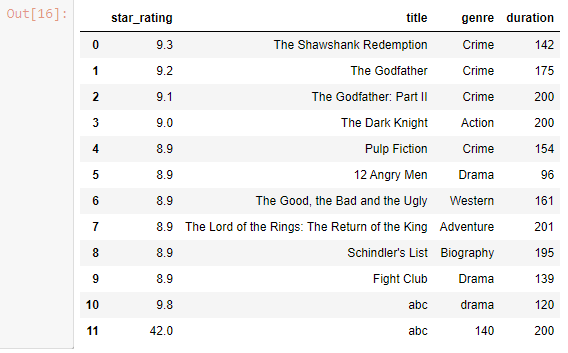
df.append({'star_rating' : 42 , 'title' : 'abc' , 'genre': 140 , 'duration': 200} , ignore_index = True)
Output-
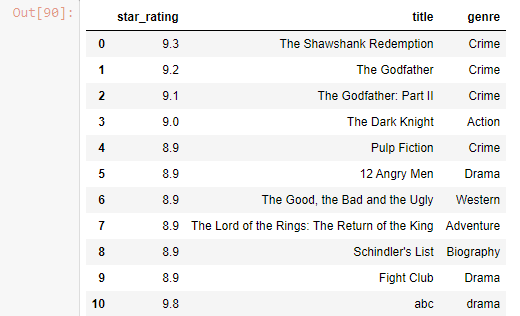
Drop Column
df.drop(columns=['duration'] , inplace = True)
df
Output-
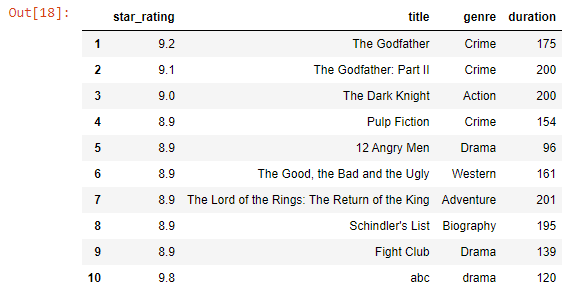
Drop Row
df.drop(index=0 , inplace = True)
df
Output-
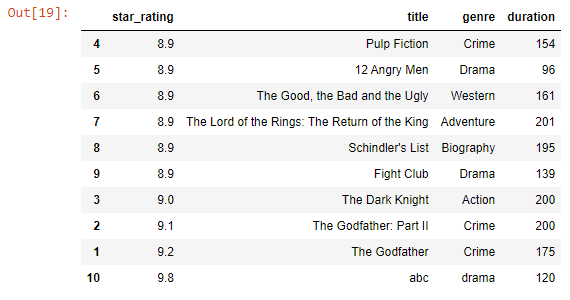
Sorting
df.sort_values(by='star_rating')
Output-
df.sort_values(by='genre')
Output-
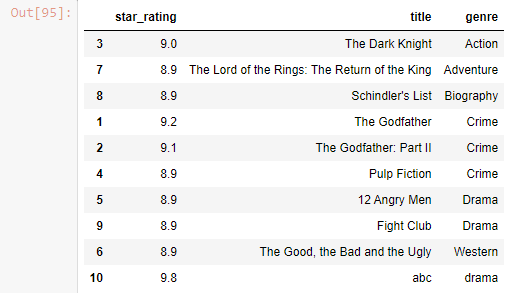
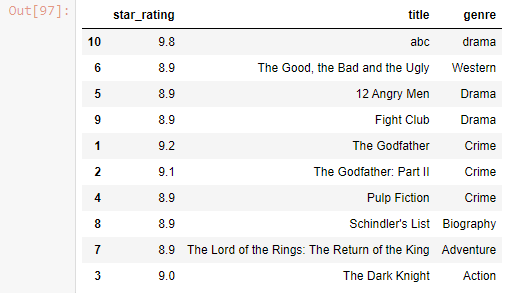
df.sort_values(by=['genre' , 'star_rating'])
Output-
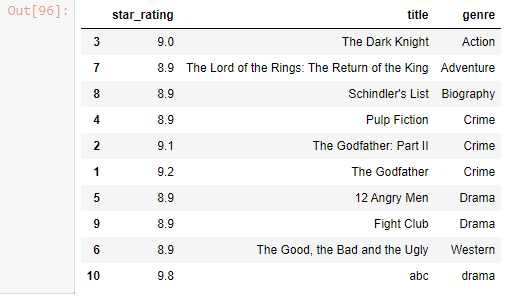
df.sort_values(by=['genre' , 'star_rating'] , ascending=False)
Output-
